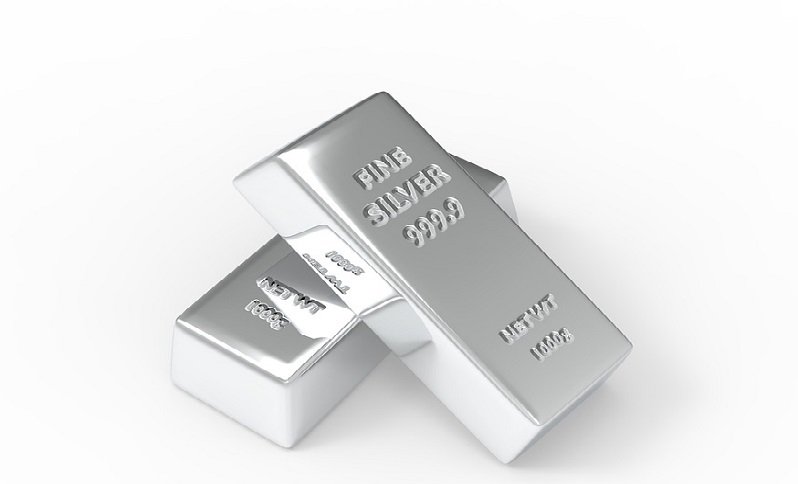
The Silver value has been falling fast since Wednesday, losing more than 10% of the value, after experiencing a notable rise in the first few months of 2024, touching $32.50 in May. So, we decided to open as sell Silver signals amidst a buoyant trading environment and a strengthening U.S. Dollar.
Silver Chart Daily – The Support Zone Below $29 Is Holding for Now
XAG/USD has lost almost $4 from the highs, with the last bearish reversal being quite steep, with five losing days in a row. However the decline has stalled at the support zone this week, with buyers continuing to make lower lows. The highs are also getting higher as the hourly chart below shows, with the 50 SMA (yellow) acting as resistance, where we decided to open our sell SILVER signal.
Silver Chart H1 – The 50 SMA Acting As Resistance
European Trading Session Overview
The European session was notably quiet in terms of economic data. The spotlight remains on the US Dollar, which has been strengthening against other major currencies and safe havens since last Wednesday. One of the most affected assets has been silver, which has seen a significant drop of more than 10% in value, now hovering around $4.
The exact reason for this decline is unclear, though economic data suggests a robust economy with inflation gradually returning to target. This has led to expectations that the Fed will lower interest rates twice this year. However, Trump’s strong candidacy and his inflationary policies may cause the Fed to slow down the rate cuts.
Silver and Commodity Metals Weak Performance
Silver experienced a sharp decline late last week, currently holding at the lows around $28.80. Despite this significant drop, silver has erased its monthly gains in the last five trading days, and is down 0.3% for the month. Today, the price remains under pressure, trading at approximately $29. However, support levels are being tested as the June lows around $28.60 come into focus, with today’s low at $28.67. A break below this level would be a significant setback to the upward momentum that has been building since March.
Commodity metals in general haven’t had a strong month with Copper resuming the steep downtrend, as we highlighted earlier. The important levels to watch include the current support zone around $28.80, followed by the low at $28.60 and further down by the 100 daily moving average at $28.35. A technical breakdown below these levels could prompt sellers to push for a more substantial decline in silver.
Silver Live Chart
SILVER


