

- The FOMC meeting minutes on Wednesday revealed that policymakers were ready to cut rates in September.
- US business activity fell in August.
- Powell’s speech confirmed a September rate cut and sunk the dollar.
The USD/CAD weekly forecast suggests a bearish trend, with the Canadian dollar gaining as the US dollar weakens after Powell’s speech.
Ups and downs of USD/CAD
The USD/CAD pair had a bearish week, with most of the move coming on Friday. The week started with the FOMC meeting minutes, revealing that policymakers were ready to cut rates in September. Afterward, data showed that US business activity fell in August, increasing bets for a September Fed rate cut.
-Are you interested in learning about forex live calendar? Click here for details-
Meanwhile, data from Canada revealed a 0.3% decline in sales, as expected. On the other hand, core retail sales jumped by an unexpected 0.3%. The week ended with Powell’s speech, which confirmed a September rate cut and sunk the dollar.
Next week’s key events for USD/CAD
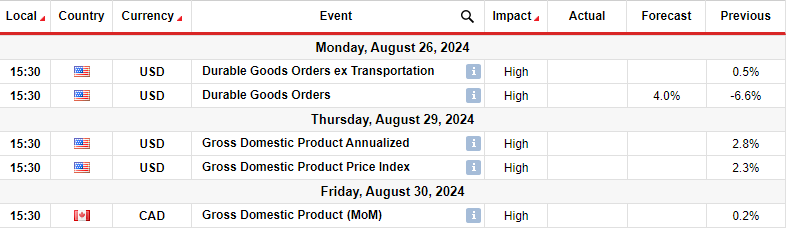
Next week, the US will release figures on core durable goods and GDP. Meanwhile, Canada will only release its GDP report. The US GDP report will show the state of the economy amid high interest rates. The last report showed a bigger-than-expected expansion, indicating resilience. Another such report could ease pressure on the Fed to lower borrowing costs. On the other hand, a poor report could increase bets for a 50 bps rate cut.
Similarly, Canada’s GDP report will shape the outlook for Bank of Canada rate cuts. Already, markets are betting on another rate cut in September.
USD/CAD weekly technical forecast: Bears break out of consolidation
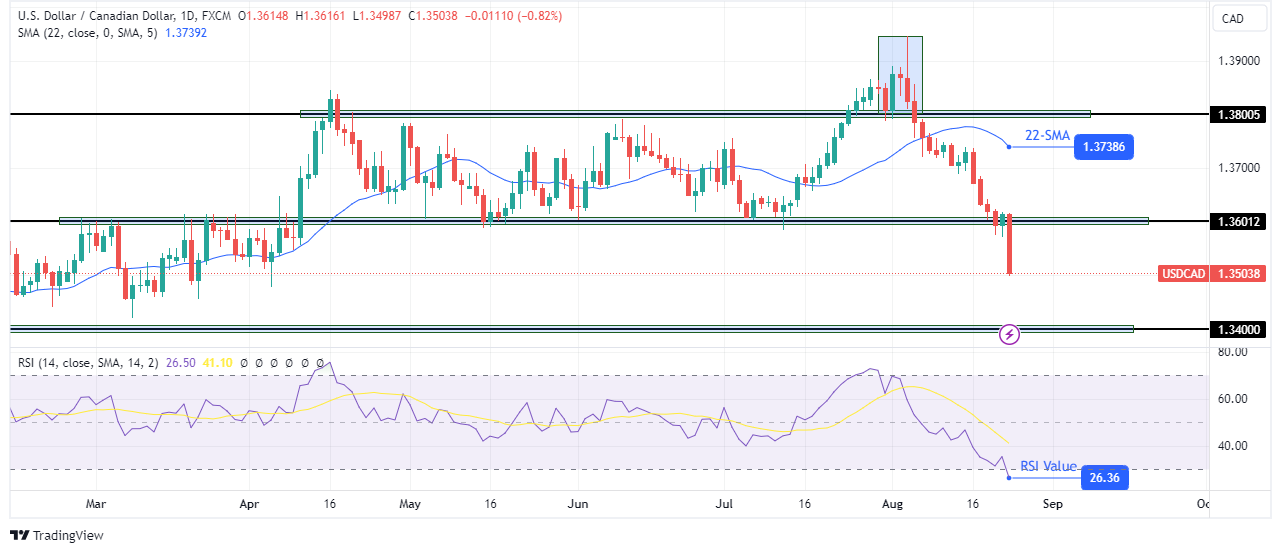
On the technical side, the USD/CAD price has broken out of consolidation with a large bearish candle. For a long time, the price has traded between the 1.3601 support and the 1.3800 resistance. When the price was ready to trend, bulls made the first attempt at the 1.3800 resistance. However, it ended up being a false breakout. The price made a large wick, indicating a rejection, before returning to the range area.
-Are you interested in learning about forex signals? Click here for details-
Bears pushed the price below the 1.3601 support level with a strong red candle. The price trades far below the 22-SMA, with the RSI in the oversold region. Therefore, the bearish bias is strong. Next week, the price might revisit the recently broken level before continuing lower.
Looking to trade forex now? Invest at eToro!
68% of retail investor accounts lose money when trading CFDs with this provider. You should consider whether you can afford to take the high risk of losing your money


