Yesterday’s early sessions saw the market deeply entrenched in negativity, with tech stocks appearing poised to drop over 10% and the USD/JPY plummeting to 141.70. However, U.S. traders managed to stabilize most assets at the height of the sell-off. There was no single headline to halt the downward spiral. Yet, a strong performance by Fed Governor Goolsbee, who redirected focus to the economy and demonstrated a steady hand, helped.
Today’s Market Expectations
Yesterday the volatility continued to be immense in almost all asset groups, so we got caught on the wrong side early in the day as Gold and cryptos crashed lower, but returned to the positive performance as the day progressed and markets calmed somewhat. e opened 8 trading signals yesterday, ending up with five winning forex signals and three losing ones.
Gold Crashes Lower But Stalls
Gold nearly reached its all-time high from last month on Friday, but subsequently reversed and dropped below $2,400 today. Fortunately, the decline was halted by the 50-day Simple Moving Average (SMA). After being unable to maintain its gains, gold declined. It remained steady during the European and Asian sessions yesterday, but fell sharply during the US session, continuing the downward trend in stocks that began last Friday. It dropped 3% on the day, or about $80, to a low of $2,364.30. On the daily chart, the retreat stopped abruptly around the 50-day SMA (yellow), which has provided support since the end of July. The fact that gold buyers are entering the market earlier and that XAU is recovering more than $50 quickly, pushing the price above $2,400, is an encouraging sign.
XAU/USD – Daily chart
GBP/USD Stays below the 5o Daily SMA
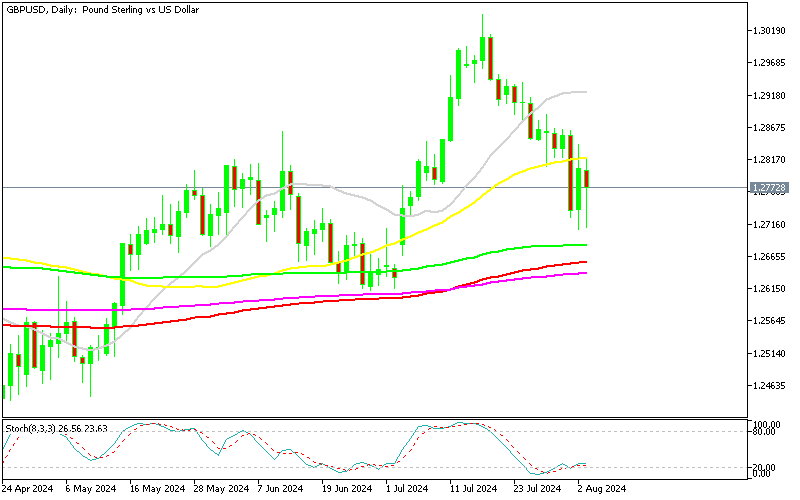
The GBP/USD pair has been fluctuating between 1.27 and 1.28 in recent days due to heightened market volatility. It dropped more than 1 cent after the Bank of England lowered the bank rate by 25 basis points, from 5.25% to 5.00%. After rising to 1.2840, the GBP/USD exchange rate was unable to sustain its gains above the 50-day Simple Moving Average (SMA), which currently acts as resistance. Following a 100-pip decline during the European session, the pair was once again rejected at this moving average yesterday.
GBP/USD – Daily Chart
Cryptocurrency Update
Going Long on Bitcoin Again After the Dip
After buyers failed to hold onto their gains from July, with the 20-weekly SMA (gray) turning into resistance, sellers took control, prompting us to open another long position in Bitcoin. As risk sentiment in the financial markets turned negative, BTC/USD fell below $50,000. However, the decline halted at the 50-weekly SMA (yellow), leading to a retracement higher. As buyers regained control, the price of BTC rose, and we decided to purchase it.
BTC/USD – Daily chart
Ethereum Makes A Swan Dive
Since early March, Ethereum has been trading at lower highs, signaling an impending negative trend despite the introduction of an ETH ETF. In June, Ethereum’s price dropped below $3,000 after peaking at $3,830. Buyers re-entered the market, pushing the price above the 50-day SMA, which had previously acted as a resistance level. However, as the decline intensified over the past few days, we witnessed another bearish reversal that drove ETH below the 200 SMA, continuing the sequence of lower highs. Yesterday, the price touched $2,000 before rebounding past $2,400.
ETH/USD – Daily chart


